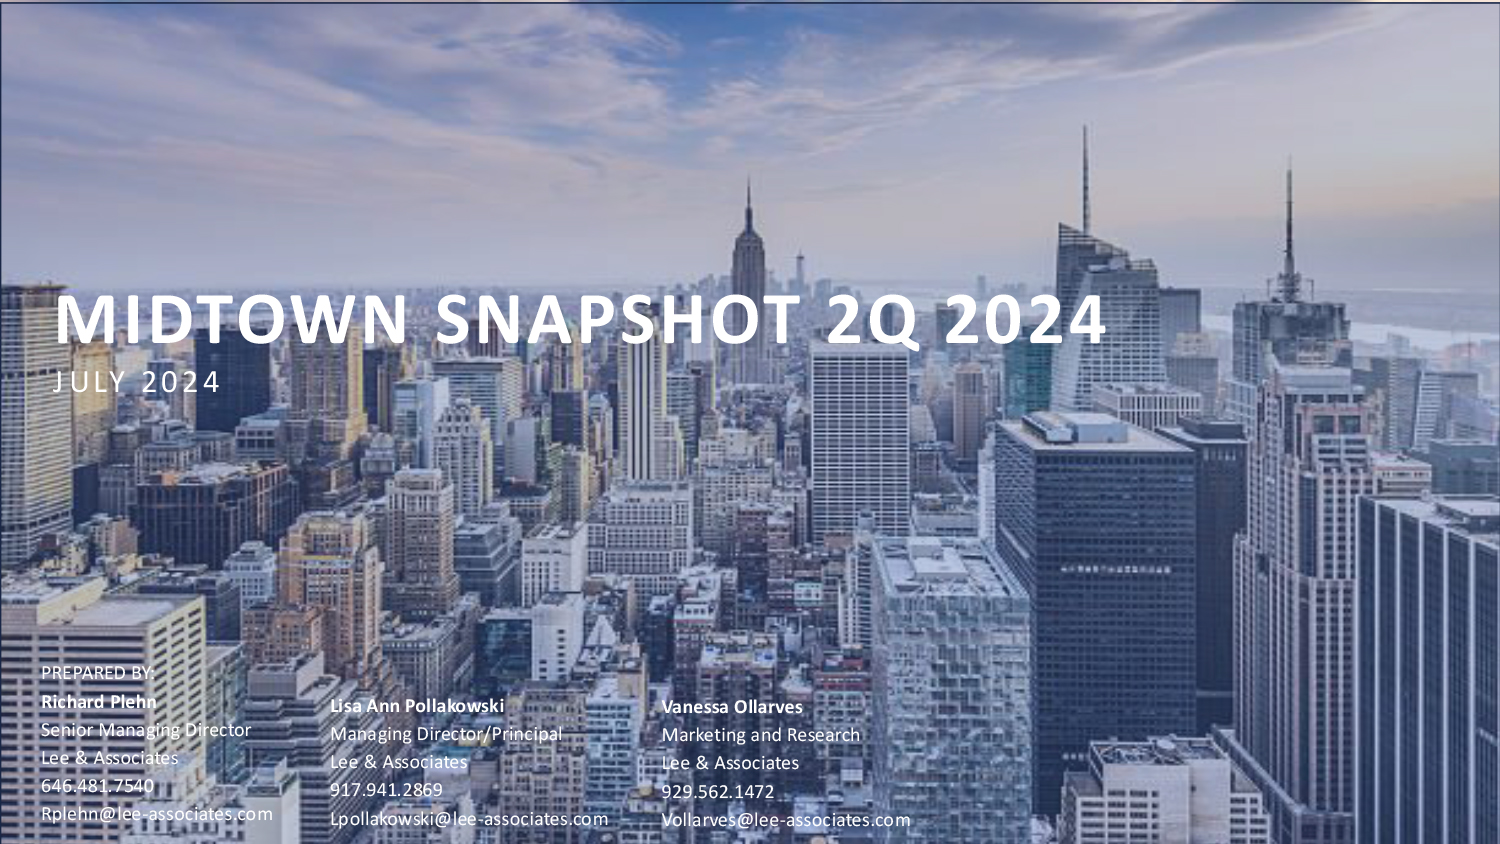
Prepared by Richard Plehn, Lisa Ann Pollakowski and Vanessa Ollarves.
Please click on the slideshow below for the full report. Alternatively, you can also follow the link on the button to read it on PDF.
SUMMARY OF THE COMMERCIAL OFFICE MARKET DOWNTOWN – Q1 2025
NEW YORK CITY ECONOMY
New York City’s economy showed positive growth with the civilian labor force expanding to 4.3 million in March 2025 from 4.2 million in March 2024. There were 20,800 jobs added to the market over the year. Sectors like healthcare and tech led gains, and transit and tourism improved, including a 16% rise in Broadway attendance. There was a 70-basis point increase in hotel occupancy rate.
Today, the government is decreasing federal fundings to non-profits, defense contractors, etc. This could have a negative effect on the commercial real estate market; however, the federal government may reverse the funding back to these organizations. Tenants are concerned about the federal trade policies representing a factor that could either positively or negatively influence the national economy and, by extension, the commercial real estate market.
ASKING RENT VS AVAILABILITY
The availability rate has declined to 16.6% in Q1 2025, marking its lowest level since Q1 2021 (down from 17.1%). Concurrently, the average rental asking price has seen a slight rise to $46.17 in Q1 2025 from $45.57 in the previous quarter. Despite this increase, average asking rents remain below pre-COVID levels, The availability rate is 8% above the average availability before pre-covid levels.
ASKING RENT VS AVAILABILITY RATE
New York City’s average office rental rate decreased from $50.52 in Q4 2024 to $49.91 in Q1 2025. The current asking rent is lower than the pre-COVID average of $59.32. The availability rate has also decreased by 70 basis points from 16.4% in Q4 2024 to 15.7 in Q1 2025. The current availability rate is higher than the pre-COVID average of 11.4%
THE ACTUAL AVAILABILITY IS LIKELY 4% TO 5% BELOW THE STATED RATE
Downtown is experiencing a reduction in available office space due to two main factors: approximately 2 million square feet are unleasable because of landlord debt renegotiations, additionally 3 million square feet are being converted to residential buildings.
JANE STREET CAPITAL’S 983,000 SQUARE FEET LEASE WAS 52% OF DOWNTOWN’S Q1 2025 LEASING.
In Q1 2025, leasing activity was 1,875,633 square feet; the average pre-COVID level was 1,652,859 square feet. Excluding the Jane Street Capital deal, approximately 900,000 square feet were leased. For the past three out of four quarters, leasing activity has been below the pre-COVID level.
TENANTS ARE HAVING A HARDER TIME FINDING QUALITY SPACE
Tenants have been leasing space in Class A buildings in Downtown post-COVID. In Q1 2025 88.9% of all leasing was completed in Class A buildings. For the past three quarters the percent of leasing in Class A buildings has increased.
WORLD TRADE CENTER LEADS DOWNTOWN SUBMARKETS IN LEASING ACTIVITY
The World Trade Center significantly outperforms other Downtown submarkets in leasing activity, with 68.2% representing 1,279,008 square feet. In second place is the Financial District with 13.3% (248,975 square feet), and in third place is the Insurance District with 8.2% (152,938 square feet).
DOWNTOWN HAS THE HIGHEST SUBLEASE SPACE % WITHIN ITS AVAILABLE INVENTORY
The Downtown available sublet market was 27.2% in Q4 2024 now it is 23.4% in Q1 2025. As sublet percent decreases landlords will begin to increase rents because of less sublet competition.
5 LARGEST DEALS COMPLETED
In this quarter, four out of five deals were direct, three out of five deals were renewals, three out of five deals were expansions, five out of five deals were done in Class A buildings, and four out of five of the largest deals were done in the World Trade Center submarket.
THE AVERAGE DOWNTOWN CONCESSION PACKAGE IS NOT REFLECTIVE OF THE MARKET
The average concession package in Q1 2025 showed a slight increase to $135.6 from $133.5 in Q1 2024; however, it decreased from $137.4 in Q1 2023. The average asking starting rents increased to $52.5 in Q1 2025 from $50.5 in Q1 2024. The typical tenant is receiving 9.2 months of free rent and $95.40 cash contribution in this quarter. The TI values are currently low because tenants typically receive less funding for renovations when renewing their leases. This past quarter saw an increase in renewals, contributing to the lower average TI value. However, if a tenant were to lease raw, unfinished space, they could expect to receive an average TI allowance of $130 to $170 per square foot.
SUMMARY
The downtown market will start to recover and become an attractive alternative for tenants who cannot find the space they are looking for in Midtown (Class A building, quality space) and will lease space in Downtown. Also, tenants needing large floor plates unavailable in Midtown South will also lease space in Downtown New York.