Prepared by Richard Plehn, and Vanessa Ollarves.
Please click on the slideshow below for the full report. Alternatively, you can also follow the link on the button to read it on PDF.
SUMMARY OF THE UNITED STATES AND NEW YORK CITY ECONOMIC DATA- Q3 2025
Overall, the US economy is showing signs of improvement. The monthly civilian labor force has increased from 167.72 million last year to 170.78 million this quarter. Although unemployment went up to 4.3%, there are now approximately 2 million more people employed than a year ago. However, job growth is slowing. The 10-year Treasury rate slightly increased to 4.12% from 3.98% the prior year, showing that interest rates did not affect the economy as much. Hotel occupancy across the country also improved slightly to 65.4%, showing a continued recovery in travel and tourism.
In New York City, the monthly civilian labor force has increased from 4.16 million to 4.24 million. However, unemployment has dropped and as a result, we now have approximately 100,000 more people working today. Private-sector employment added just 14,300 jobs, compared with the 75,000 added in the same period in 2024. The Broadway theater industry saw revenue increase to $30.78 million, and hotel occupancy climbed to 82.3%, showing that tourism and entertainment remain strong.
The economic slowdown in both NYC and the US can be attributed to CEOs believing they won’t need to hire as many employees, because they can replace them with AI. Also, CEO of companies, who have loans due are concerned about refinancing loans.
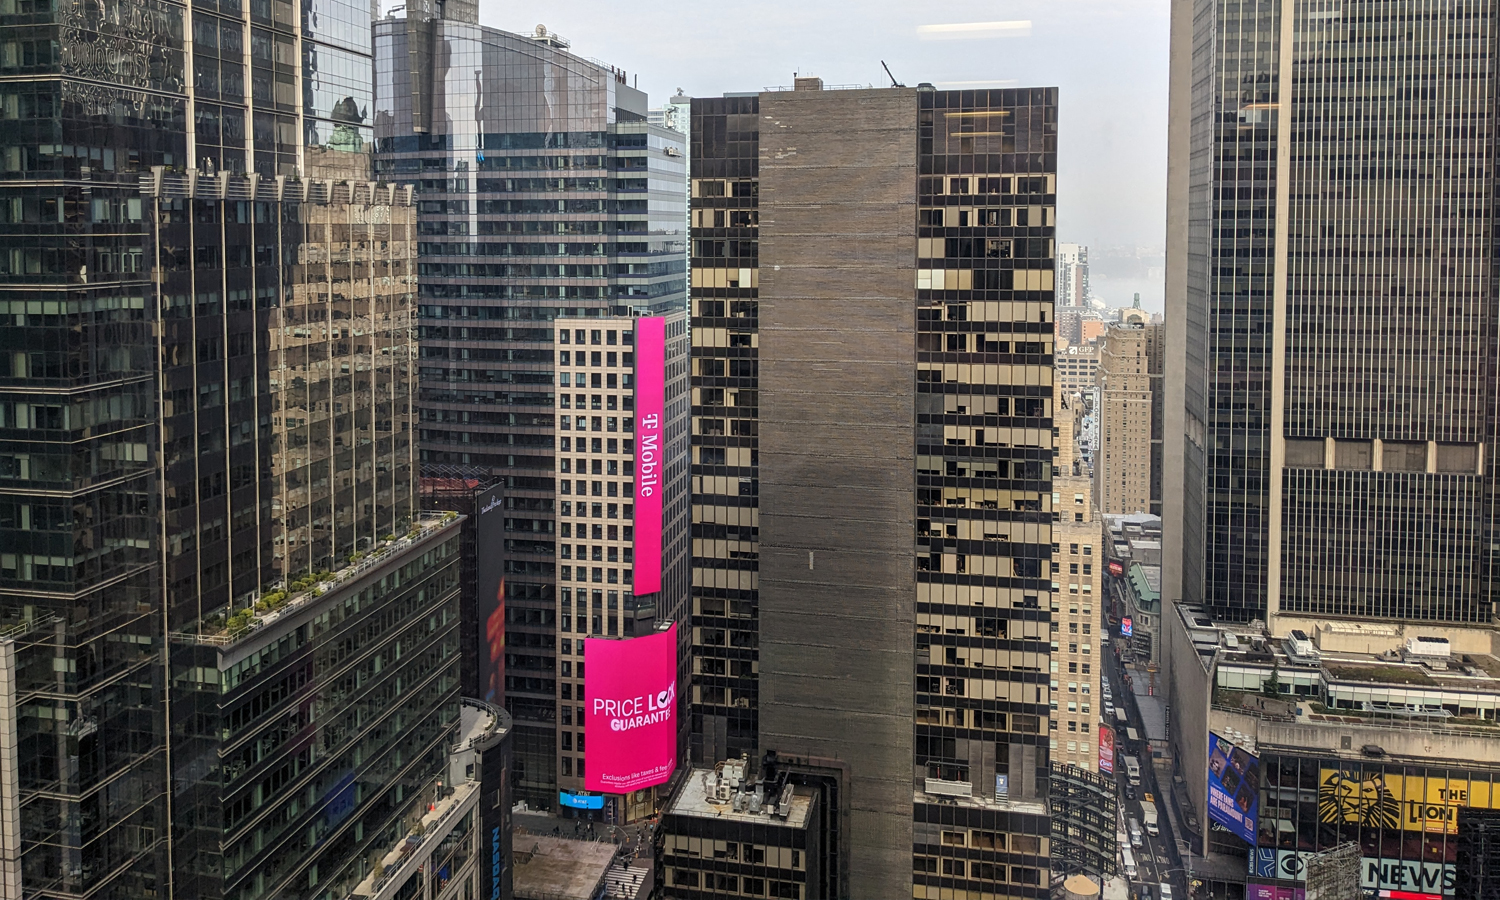
RENTS SLIGHTLY DECREASE AS AVAILABILITY RATE DECREASES
In the third quarter of 2025, asking rents decreased to $49.68 from $50.39 in Q2 2025, the availability rate also fell to 14.5% from 15.1% in Q2 2025. This decline may be attributed to leasing space in Class A buildings, where the rent is higher than average. As a result, when the space is leased, the average rents decrease. Although this downward trend continues, they are still significantly higher than the 5-year average pre-COVID low of 8.1%. It’s important to note, that as shown in previous quarters, the availability rate could be lower due to office buildings being converted into residential units and other office buildings under financial stress.
ASKING RENTS VS AVAILABILITY IN THE MARKETS
Midtown continues to have the lowest availability rate among the three markets at 13.9%, which is a decrease from the previous quarter. Midtown South has the highest availability rate at 15.6%, while Downtown’s stands at 15%. Regarding base rent, Midtown South leads with $52.40, followed by Midtown at $50.50. Downtown offers the lowest base rent at $46.20. It is important to note, that some landlords do not list their prices, and if they did, Midtown North would likely have higher rents than Midtown South.
LEASING ACTIVITY IS BELOW PRE-COVID LEVELS
Leasing activity experienced a significant decline this quarter, reaching 8,807,838 square feet compared to 10,434,315 square feet in Q2 2025, and falling below the pre-COVID level of 9,963,875 square feet. The total leasing activity for this year is 30.5 million square feet. At this pace, we are on track to surpass pre-COVID leasing figures.
THE MIDTOWN MARKET KEEPS DOMINATING IN LEASING ACTIVITY
The Midtown market has led overall leasing activity. In this quarter, Midtown accounted for 65.8% (5,962,812 square feet) of total leasing. Midtown South comprised 22.5%, while Downtown represented 11.7% of the market.
PENN PLAZA MARKET HAD THE MOST LEASING
Among individual submarkets, the Penn Plaza/Garment district recorded the highest volume at 2,260,937 square feet, followed by the Plaza District at 1,698,520 square feet and Grand Central at 978,846 square feet, in Midtown South Chealsea had the highest leasing activity with 819,691 square feet and in Downtown, Financial District with 600,455 square feet. The Plaza District and Penn Plaza/Garment leased more space than any other Downtown submarket.
CLASS A OFFICE BUILDINGS DOMINATED THE LEASING
Leasing activity was dominated by Class A buildings, with 65.7% (5,827,156 square feet), which is below the post-Covid average of 67.8% (6.1 million square feet) over the last five years. Class B buildings represented 26.5% (2,349,904 square feet), while Class C buildings comprised 7.8% (693,949 square feet).
THE PIPELINE FOR NEW OFFICE BUILDINGS KEEPS DECREASING
The pace of new office building construction in New York City has steadily declined each quarter. In Q3 2021, there were 17.4 million square feet buildings under construction. As of Q3 2025, only 2 million square feet (five buildings), remain under construction, indicating a significant reduction in future new spaces. The market is now transitioning into a phase where landlords will renovate Class B properties to attract high end tenants. Also, landlords will start to build new buildings.
LARGE USERS ARE HAVING A HARDER TIME FINDING LARGE BLOCKS OF SPACE
Large users (over 500,000 square feet) are going to have a harder time finding space, because there are only 10 buildings in NYC that can accommodate. Currently there are over 11 tenants looking for more than 500,000 square feet.
10 LARGEST DEALS COMPLETED IN MANHATTAN
10 out of 10 top deals were done in class A buildings, nine out of 10 were direct deals, five out of five were relocations, and in nine out of 10 deals the tenant leased more space. Five of the 10 biggest transactions were for financial services firms, 3 out of the 10 were for Media/Tech Firms. Deloitte signed a relocation and expansion lease for 807,000 square feet at 70 Hudson Yards, representing nearly three-quarters of the building. WeWork/Amazon renewed and expanded for 58,103 square feet at 1440 Broadway, this is part of Amazon’s strategy to consolidate office space in Manhattan and support its return-to-office goals, the company has partnered with WeWork, which is acting as the lessor in this arrangement. Guggenheim Partners signed a 17-year renewal and expansion at 330 Madison Avenue, increasing its footprint from approximately 240,000 to 360,000 square feet. With this deal, the building is now reported at 100% leased.
NET EFFECTIVE RENTS CONTINUE TO INCREASE
The Landlord Net Effective has been steadily increasing by 3% per year, from $67.14 per square foot in the third quarter of 2024 to $68.54 per square foot in the third quarter of 2025. The average lease term is six years and 10 months, with 6.6 Months of free rent and $104.3 at work. Please note, that the average lease terms differ by market: Midtown and Downtown typically have seven-year terms, while Midtown South averages five-year terms.
MANHATTAN IS IMPROVING
Manhattan’s overall leasing market will have its best year since COVID. However, Landlords are having a hard time covering real estate Taxes, operating expenses, and debt service because of the low rent and high concessions packages landlords need to offer tenants today. Please note, net effective rents have been increasing, but they are not high enough to cover all the cost.